
Know the network. Plan the work.
Engineer-led roadway assessments that turn pavement condition, geometry, imagery, and asset data into defensible maintenance priorities.
One survey. Multiple decisions.
Eclipse combines right-sized field collection, efficient processing, and engineering judgement so municipalities can understand current conditions, set priorities, and build a practical capital plan.
Capture the network
Collect synchronized geometry, location, and visual records while limiting traffic disruption and repeat field work.
Measure what matters
Translate raw observations into segment-level condition, deterioration, safety, and asset information.
Prioritize the work
Connect condition to treatment timing, budget scenarios, and the next engineering or permitting decision.
See the network clearly.
Move from scattered files to a map-based view of condition, assets, priorities, and planned investment.
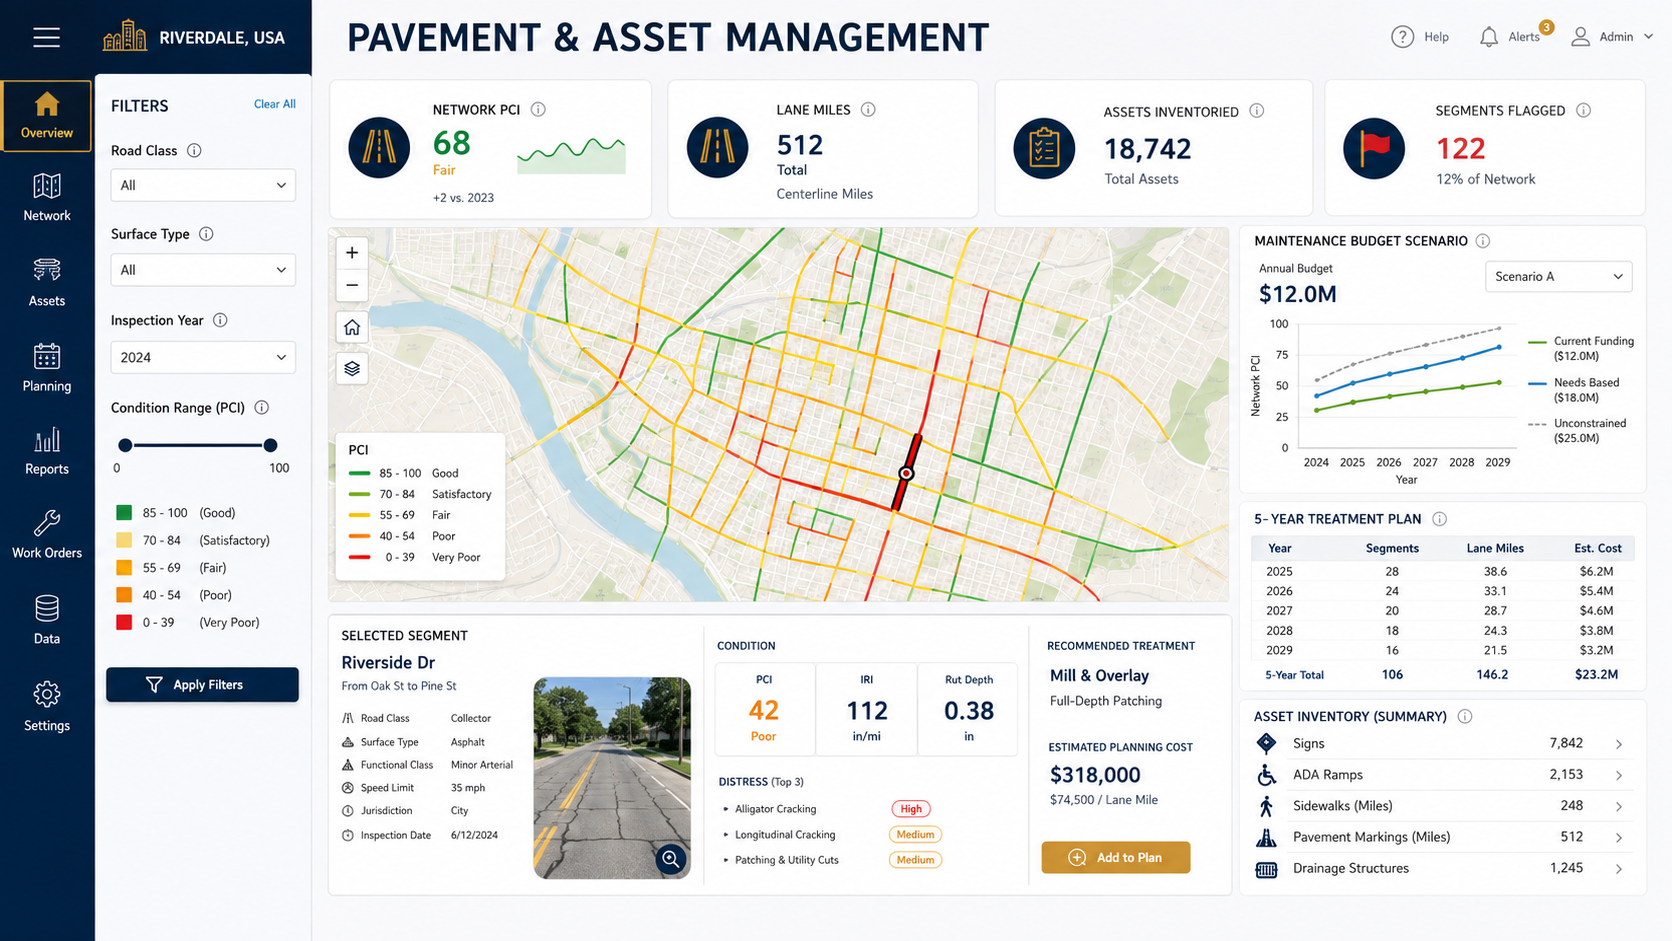
Conceptual interface shown with synthetic data. Final dashboards and metrics are configured to the client's scope, standards, and systems.
Built around the work.
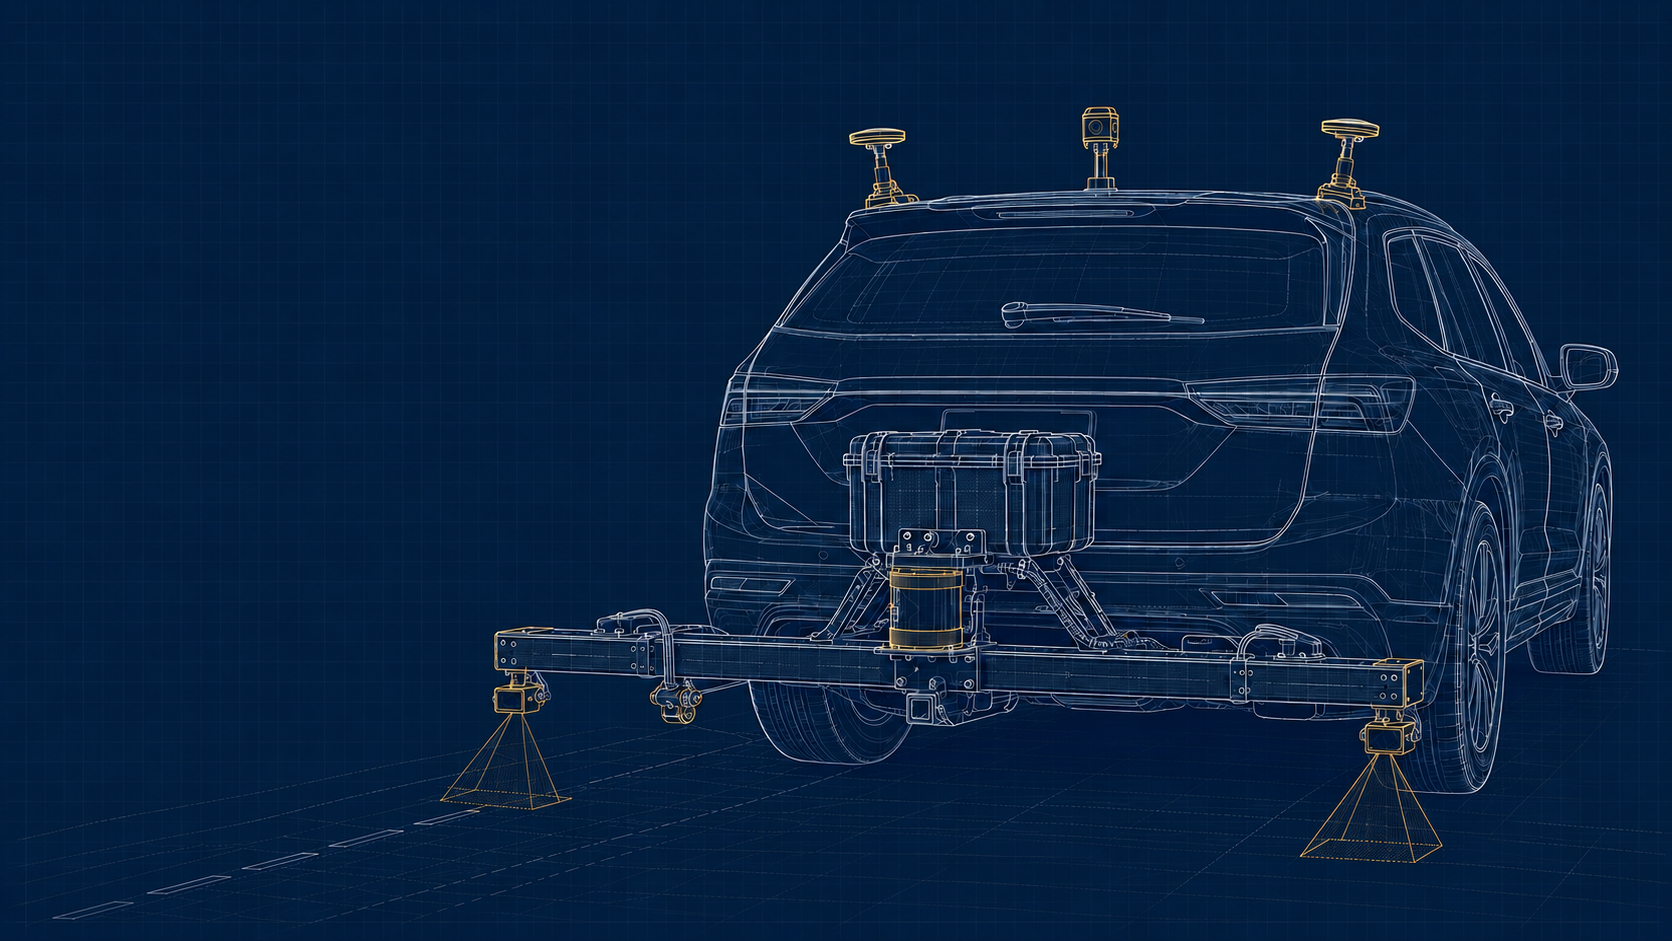
Our planned modular platform combines complementary sensors instead of forcing every project into one fixed collection package.
Wide-field 3D LiDAR
A Blickfeld Robin W–based configuration is planned for roadway and right-of-way geometry, spatial context, and asset location.
Dual laser profilers
LMI Gocator line profilers support transverse pavement geometry, cross-section measurements, and rut-depth analysis.
360° imagery
An Insta360-based visual record connects observed conditions and assets to their real-world roadway context.
RTK positioning
RTK GNSS and inertial positioning tie field observations to usable coordinates and consistent project control.
Stationing + time sync
Wheel-encoder distance and synchronized timestamps align sensor streams for repeatable processing and review.
Modular deployment
A transferable hitch-mounted platform supports roadway collection, with a plug-in bike-trailer approach planned for sidewalks.
Equipment is configured and validated for the required deliverables; final sensors, methods, tolerances, and standards are confirmed during scoping.
Collect with confidence.
A Linux-based acquisition workflow is planned to give the operator a clear view of route progress, sensor health, positioning, storage, and locations that need follow-up.
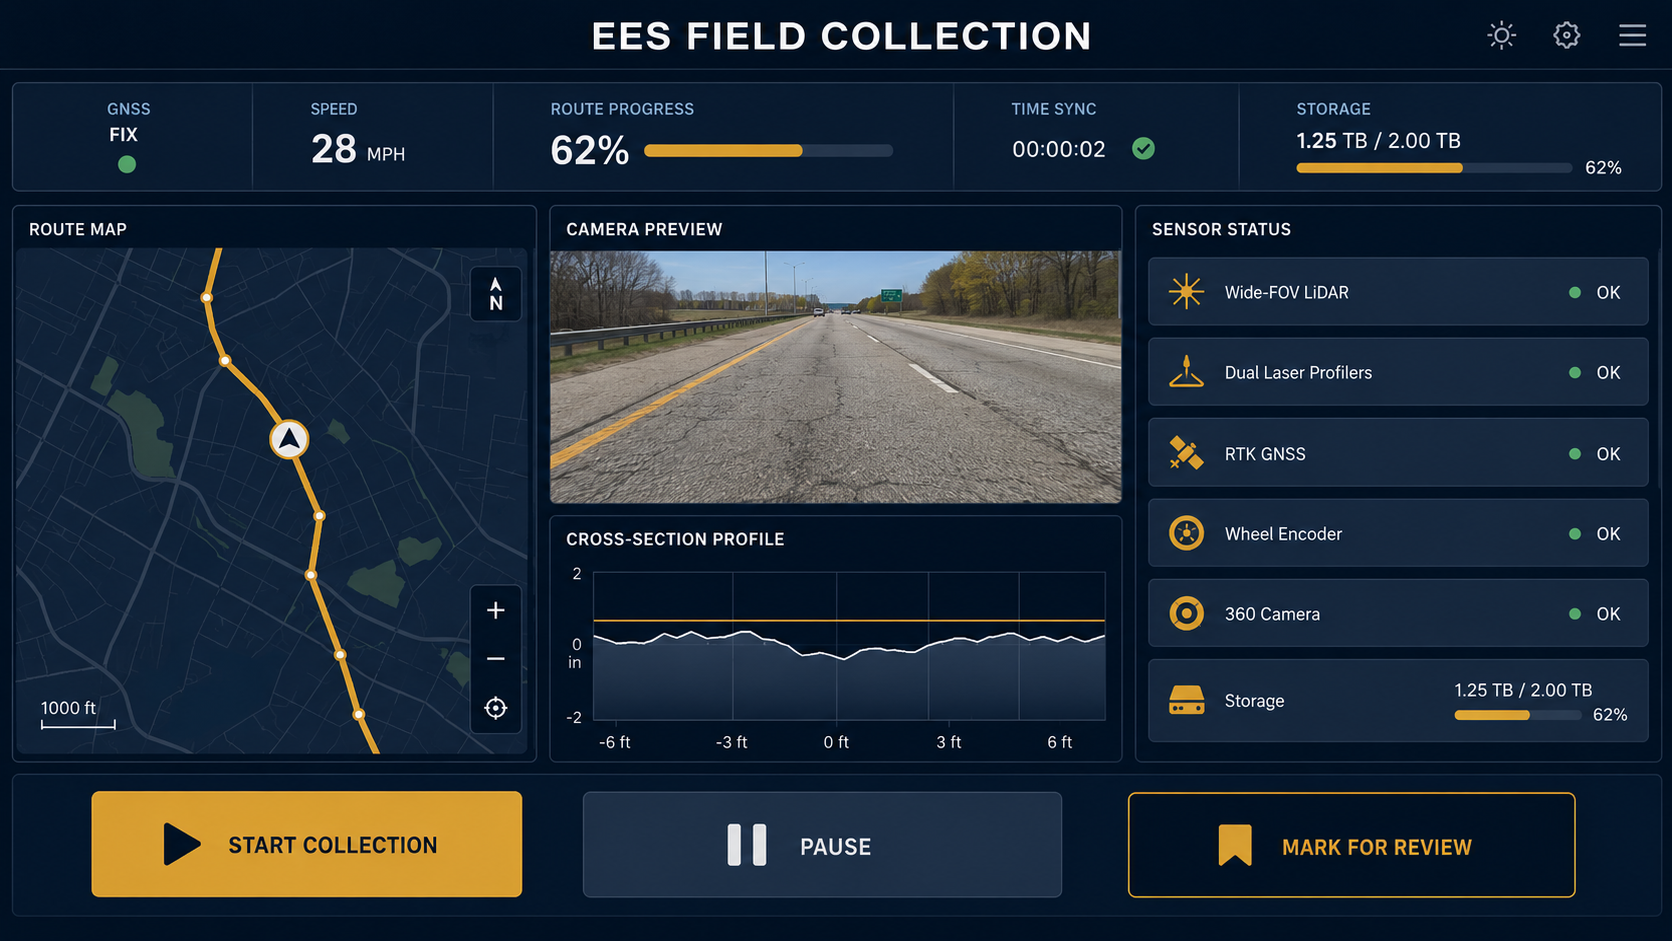
Conceptual field interface. The production layout will evolve through hardware integration, testing, and operator feedback.
Data your team can use.
Deliverables are tailored to the decision—not just the sensor—and can be structured for direct use in Esri and common municipal workflows.
Condition data
Segment ratings, distress locations, rutting and cross-section results, plus PCI or ride-quality measures when included in the validated scope.
Visual record
Georeferenced roadway imagery that helps staff verify findings, answer questions, and reduce unnecessary return trips.
Asset inventory
Signs, markings, curb ramps, sidewalks, curbs, and drainage assets can be inventoried when included in the project scope.
GIS delivery
Esri geodatabases, web maps, dashboards, tabular exports, and clear data dictionaries built around client ownership and reuse.
Treatment plan
Segment-level preservation, rehabilitation, and reconstruction recommendations linked to observed condition and service goals.
Budget scenarios
Prioritized programs and multi-year scenarios that show what different funding levels can accomplish across the network.
Clear from start to finish.
We define the decision first, then match the collection, analysis, and review effort to it.
Define
Confirm decisions, standards, assets, accuracy, and outputs.
Collect
Capture synchronized field data with in-field quality checks.
Process
Align, calculate, classify, and flag results for review.
Verify
Review flagged locations, spot-check outputs, and resolve gaps.
Deliver
Provide usable data, priorities, documentation, and next steps.
Automation helps. Engineers decide.
Scripting and automated analysis can accelerate calculations, organize large datasets, and identify locations that need attention. Engineering review remains part of the deliverable.
Right-sized by design.
The goal is not to collect the most data. It is to collect the right data, verify it, and turn it into a decision your team can defend.
Direct access
Work with the professionals responsible for the field plan, analysis, and recommendations.
Useful ownership
Receive documented, reusable data that fits your GIS and management workflow.
Next-step engineering
Carry findings into design, drainage, permitting, budgeting, and implementation support.
Bring us the network question.
We will help define the collection level, deliverables, and quality controls needed to make the next decision.